Search within this section
Select a section below and enter your search term, or to search all click Fair value measurements, global edition
Favorited Content
 View image
Type of derivative |
Amount |
Asset/(liability) |
||
Interest rate swap |
$(20,000) |
Liability |
||
Interest rate swap |
10,000 |
Asset |
||
Total interest rate swaps |
$(10,000) |
Net liability |
||
Gas commodity contract |
6,000 |
Asset |
||
Gas commodity contract |
5,000 |
Asset |
||
Electricity commodity contract |
8,000 |
Asset |
||
Electricity commodity contract |
(12,000) |
Liability |
||
Total commodity contracts |
$7,000 |
Net asset |
||
Total of all contracts |
$(3,000) |
Net liability |
Derivative type |
Position |
Collateral |
Asset/(liability) |
|||
Interest rate swaps |
$(10,000) |
$ — |
$(10,000) |
|||
Commodity contracts |
7,000 |
(5,000) |
2,000 |
Type of derivative |
Amount |
Asset/(liability) |
||
Interest rate swap |
$(20,000) |
Liability |
||
Interest rate swap |
10,000 |
Asset |
||
Total interest rate swaps |
$(10,000) |
Net liability |
||
Gas commodity contract |
6,000 |
Asset |
||
Gas commodity contract |
5,000 |
Asset |
||
Electricity commodity contract |
8,000 |
Asset |
||
Electricity commodity contract |
(12,000) |
Liability |
||
Total commodity contracts |
$7,000 |
Net asset |
||
Total of all contracts |
$(3,000) |
Net liability |
Method |
Advantages |
Disadvantages |
Historical default rates
|
|
|
Bond prices and yields (credit spreads)
|
|
|
Credit default swaps
|
|
|
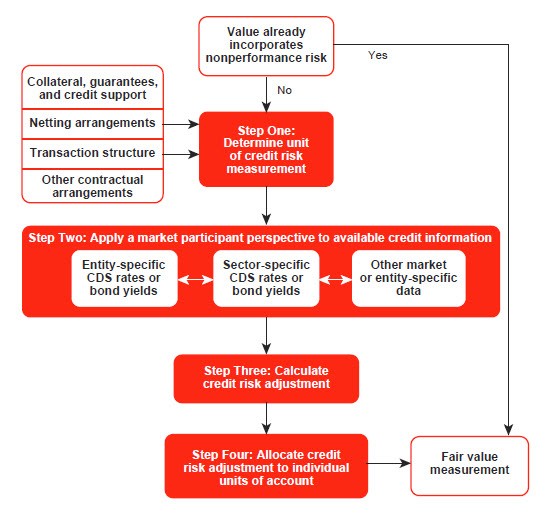
Pre-credit-adjusted rate |
5.00% |
Credit spread |
4.50% |
Total rate |
9.50% |
Cash flows (un-discounted) |
Cash flows discounted at pre-credit-adjusted rate |
Cash flows discounted at credit-adjusted rate |
Impact of credit |
|
Principal payment at maturity |
$1,000,000
|
$780,009 |
$625,348 |
$(154,661) |
Quarterly dividend stream of 7% |
$350,000
|
$307,988 |
$276,059 |
$(31,929) |
Total value |
$1,350,000 |
$1,087,997 |
$901,407 |
$(186,590) |
Historical default rates |
Credit spread |
CDS rates |
|
One year |
0.23% |
1.74% |
2.74% |
Two year |
0.54% |
1.89% |
2.58% |
Year |
Expected outflow |
Pre-credit-adjusted discount rate (%) |
CDS quote (%) |
Risk adjusted discount rate (%) |
Pre-credit-adjusted discounted value |
Fair value |
Risk adjustment |
(t) |
(a) |
(b) |
(c) |
(d)=(b)+(c) |
e)=(a)/(1+(b)) ^t |
(f)=(a)/(1+(d)) ^t |
(f)−(e) |
1 |
$333,333 |
1.00 |
0.38 |
1.38 |
$330,033 |
$328,796 |
$(1,237) |
2 |
$333,333 |
1.50 |
0.45 |
1.95 |
$323,554 |
$320,704 |
$(2,850) |
3 |
$333,333 |
1.70 |
0.60 |
2.30 |
$316,894 |
$311,352 |
$(5,543) |
Total |
$970,481 |
$960,851 |
$(9,630) |
||||
(a) Expected outflow is the notional amount times the net payment of 1% annually. (b) Discount rate is the pre-credit-adjusted rate at the three dates. (c) Default assumptions for senior unsecured credit. CDS quote can be obtained from a pricing service such as Bloomberg. |
|||||||
Year |
Expected outflow |
Pre-credit-adjusted discount rate (%) |
Pre-credit-adjusted discounted value |
Exposure |
CDS quote (%) |
Recovery rate (%) |
Term default probability (%) |
Default probability (%) |
Bucket risk adjustment |
(t) |
(a) |
(b) |
(c)=(a)/ (1+(b))^t |
(d)=sum of remaining (c) |
(e) |
(f) |
(g)=1−exp (−(e)/ (1−(f))×t) |
(h)= change in (g) |
−(d)×(h)× 1−(f)) |
1 |
$333,333 |
1.00 |
$330,033 |
970,481 |
0.38 |
40 |
0.63 |
0.63 |
$(3,668) |
2 |
$333,333 |
1.50 |
$323,554 |
640,448 |
0.45 |
40 |
1.49 |
0.86 |
$(3,305) |
3 |
$333,333 |
1.70 |
$316,894 |
316,894 |
0.60 |
40 |
2.96 |
1.47 |
$(2,795) |
Total |
$970,481 |
2.96 |
$(9,768) |
||||||
(a) Expected outflow is the notional amount times the net payment of 1% annually. (b) Discount rate is the pre-credit-adjusted rate at the three dates. (d) Exposure is the present value of all the remaining cash flows as of the measurement date. (e) Default assumptions for senior unsecured credit. CDS quote can be obtained from a pricing service such as Bloomberg. (f) Recovery rate is the standard assumption for senior unsecured CDS. |
|||||||||
Year |
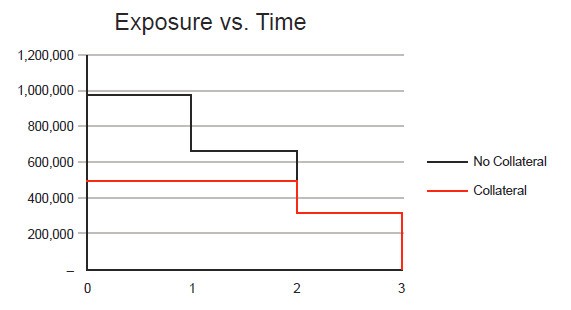
Bucket exposure |
CDS quote (%) |
Recovery rate (%) |
Term default probability (%) |
Bucket default probability (%) |
Bucket risk adjustment |
(t) |
(a) |
(b) |
(c) |
(d)=1−exp(−(b)/ (1−(c))×t) |
(e)=change in (d) |
-(a)×(e)×(1−(c)) |
1 |
$500,000 |
0.38% |
40% |
0.63% |
0.63% |
$(1,890) |
2 |
$500,000 |
0.45% |
40% |
1.49% |
0.86% |
$(2,580) |
3 |
$316,894 |
0.60% |
40% |
2.96% |
1.47% |
$(2,795) |
Total |
2.96% |
$(7,265) |
||||
(a) Bucket exposure is the lower of the bucket exposure from the previous example (in which there was no collateral) and the collateral threshold in this example of $500,000. (b) CDS quote can be obtained from a pricing service such as Bloomberg. Above are the default assumptions for senior unsecured credit. (c) Recovery rate is the standard assumption for senior unsecured CDS. |
||||||
Derivative |
Amount |
Classification |
|
Derivative 1 |
$(1,000) |
Liability |
|
Derivative 2 |
1,500 |
Asset |
|
Derivative 3 |
(2,000) |
Liability |
|
$(1,500) |
Net liability |
Derivative 1 |
$(1,000) |
Divided by net position |
(1,500) |
Allocation percentage |
66.66% |
Multiplied by total credit risk adjustment |
150 |
Allocated credit risk adjustment |
$100 |
Derivative 1 |
$(1,000) |
Divided by total liability position |
(3,000) |
Allocation percentage |
33.33% |
Multiplied by total credit risk adjustment |
150 |
Allocated credit risk adjustment |
$50 |
Derivative |
Amount |
Classification |
Derivative 1
|
$(1,000)
|
Liability
|
Derivative 2
|
1,500
|
Asset
|
Derivative 3
|
(2,000)
|
Liability
|
$(1,500)
|
Net liability
|
Derivative 1—Standalone credit risk |
$100 |
Divided by total credit risk adjustment for all derivatives on a stand-alone basis (a) |
225 |
Allocation percentage |
44.44% |
Multiplied by total credit risk adjustment |
150 |
Allocated credit risk adjustment |
$67 |
(a) Sum of the standalone credit risk adjustments for Derivate 1 ($100), Derivative 2 (-$75), and Derivative 3 ($200). |
|
Relative fair value — method 1 |
Relative fair value — method 2 |
Relative credit adjustment |
|||
Derivative 1 |
$ 100 |
$ 50 |
$67 |
||
Derivative 2 |
(150) |
— |
(50) |
||
Derivative 3 |
200 |
100 |
133 |
||
Total adjustment |
$ 150 |
$150 |
$150 |
||
Net asset adjustment |
$(150) |
— |
$ (50) |
||
Net liability adjustment |
$ 300 |
$150 |
$200 |
Current |
Long-term |
Total |
|||
Derivative 1 |
$ 500 |
$(1,500) |
$ (1,000) |
||
Derivative 2 |
1,500 |
— |
1,500 |
||
Derivative 3 |
(1,000) |
(1,000) |
(2,000) |
||
Net position |
$1,000 |
$(2,500) |
$ (1,500) |
Derivative 1 – current position |
$500 |
Divided by net position |
(1,500) |
Allocation percentage |
(33.33)% |
Multiplied by total credit adjustment |
150 |
Allocated credit adjustment |
$(50) |
Derivative 1 – long-term |
$(1,500) |
Divided by net position |
(1,500) |
Allocation percentage |
100% |
Multiplied by total credit adjustment |
150 |
Allocated credit adjustment |
$150 |
Current |
Long-term |
Total |
|||
Derivative 1 |
$ (50) |
$150 |
$ 100 |
||
Derivative 2 |
(150) |
— |
(150) |
||
Derivative 3 |
100 |
100 |
200 |
||
Total adjustment |
$(100) |
$250 |
$ 150 |
||
Net asset adjustment |
$(200) |
— |
$(200) |
||
Net liability adjustment |
$ 100 |
$250 |
$ 350 |
PwC. All rights reserved. PwC refers to the US member firm or one of its subsidiaries or affiliates, and may sometimes refer to the PwC network. Each member firm is a separate legal entity. Please see www.pwc.com/structure for further details. This content is for general information purposes only, and should not be used as a substitute for consultation with professional advisors.

Select a section below and enter your search term, or to search all click Fair value measurements, global edition